
Geospatial Applications for an ESIA
(330km 400Kv Overhead Transmission Line (OHTL) Running from Southern Kuwait to Iraq)
By Mark Brown, WKC Group
WKC’s International Environmental Impact Assessment Team have recently completed an Environmental and Social Impact Assessment (ESIA) for a 330km 400Kv overhead transmission line (OHTL) running from Southern Kuwait to Iraq. The ESIA’s prime objective was to meet the IFC (International Finance Corporation) performance standards and Equator Principles in order to secure Project finance. Due to the distance over which the project covered, social and biodiversity considerations were paramount to the success of the ESIA, as such the use of our geospatial solutions services was a key tool in this process.
Space Based Habitat Mapping
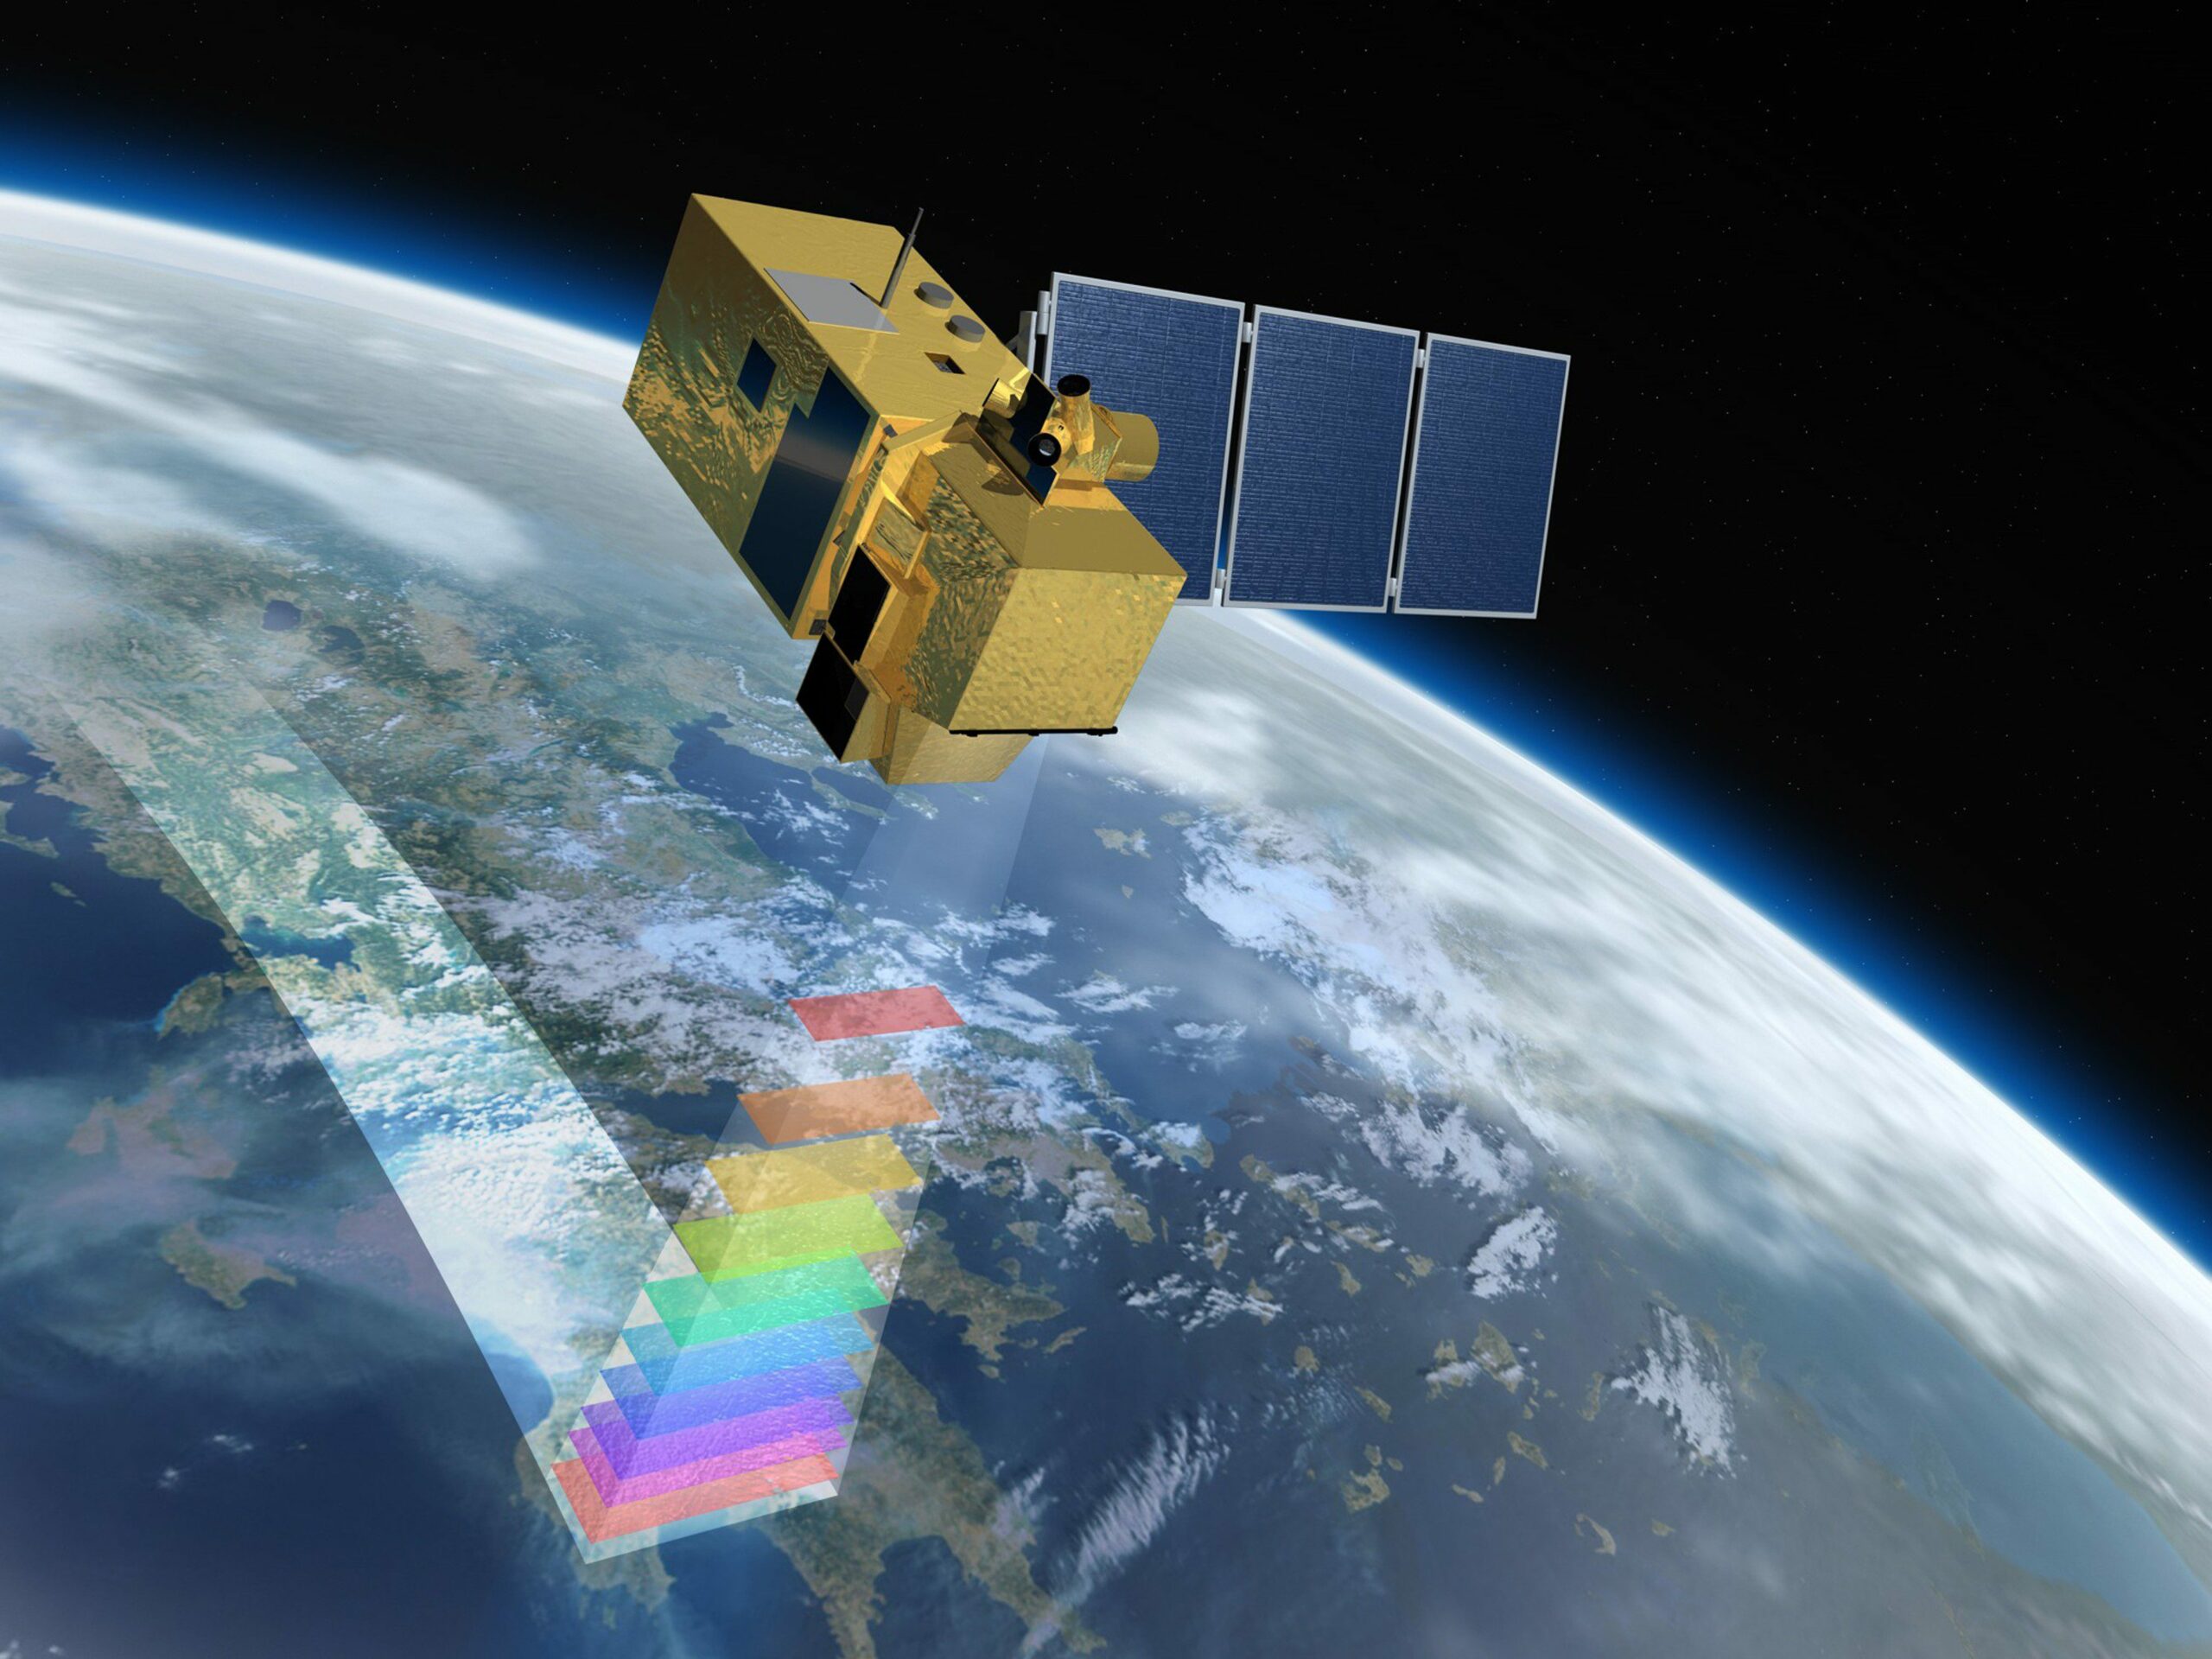
Satellite technology played a pivotal role in this study (Image Copyright © ESA and Airbus Defence and Space. All rights reserved.)
Habitat mapping was carried out along the entire length of the proposed OHTL. This is an important aspect of the ESIA to determine if any vulnerable and sensitive habitats would be impacted by the construction.
A modern approach using optical satellite imagery combined with machine learning techniques for land cover mapping was adopted.
Machine learning is a branch of artificial intelligence where algorithms and statistical models are used to perform a specific task without using explicit instructions, relying on patterns and inference instead.
Basically, when carrying out this kind of analysis, representative samples of habitats throughout a project area are identified either by field teams of ecologists or an experienced satellite image interpreter. Known as training data this is then fed into a machine learning algorithm. The algorithm then refers to the training samples and decides what the habitat types should be throughout the rest of the project area.
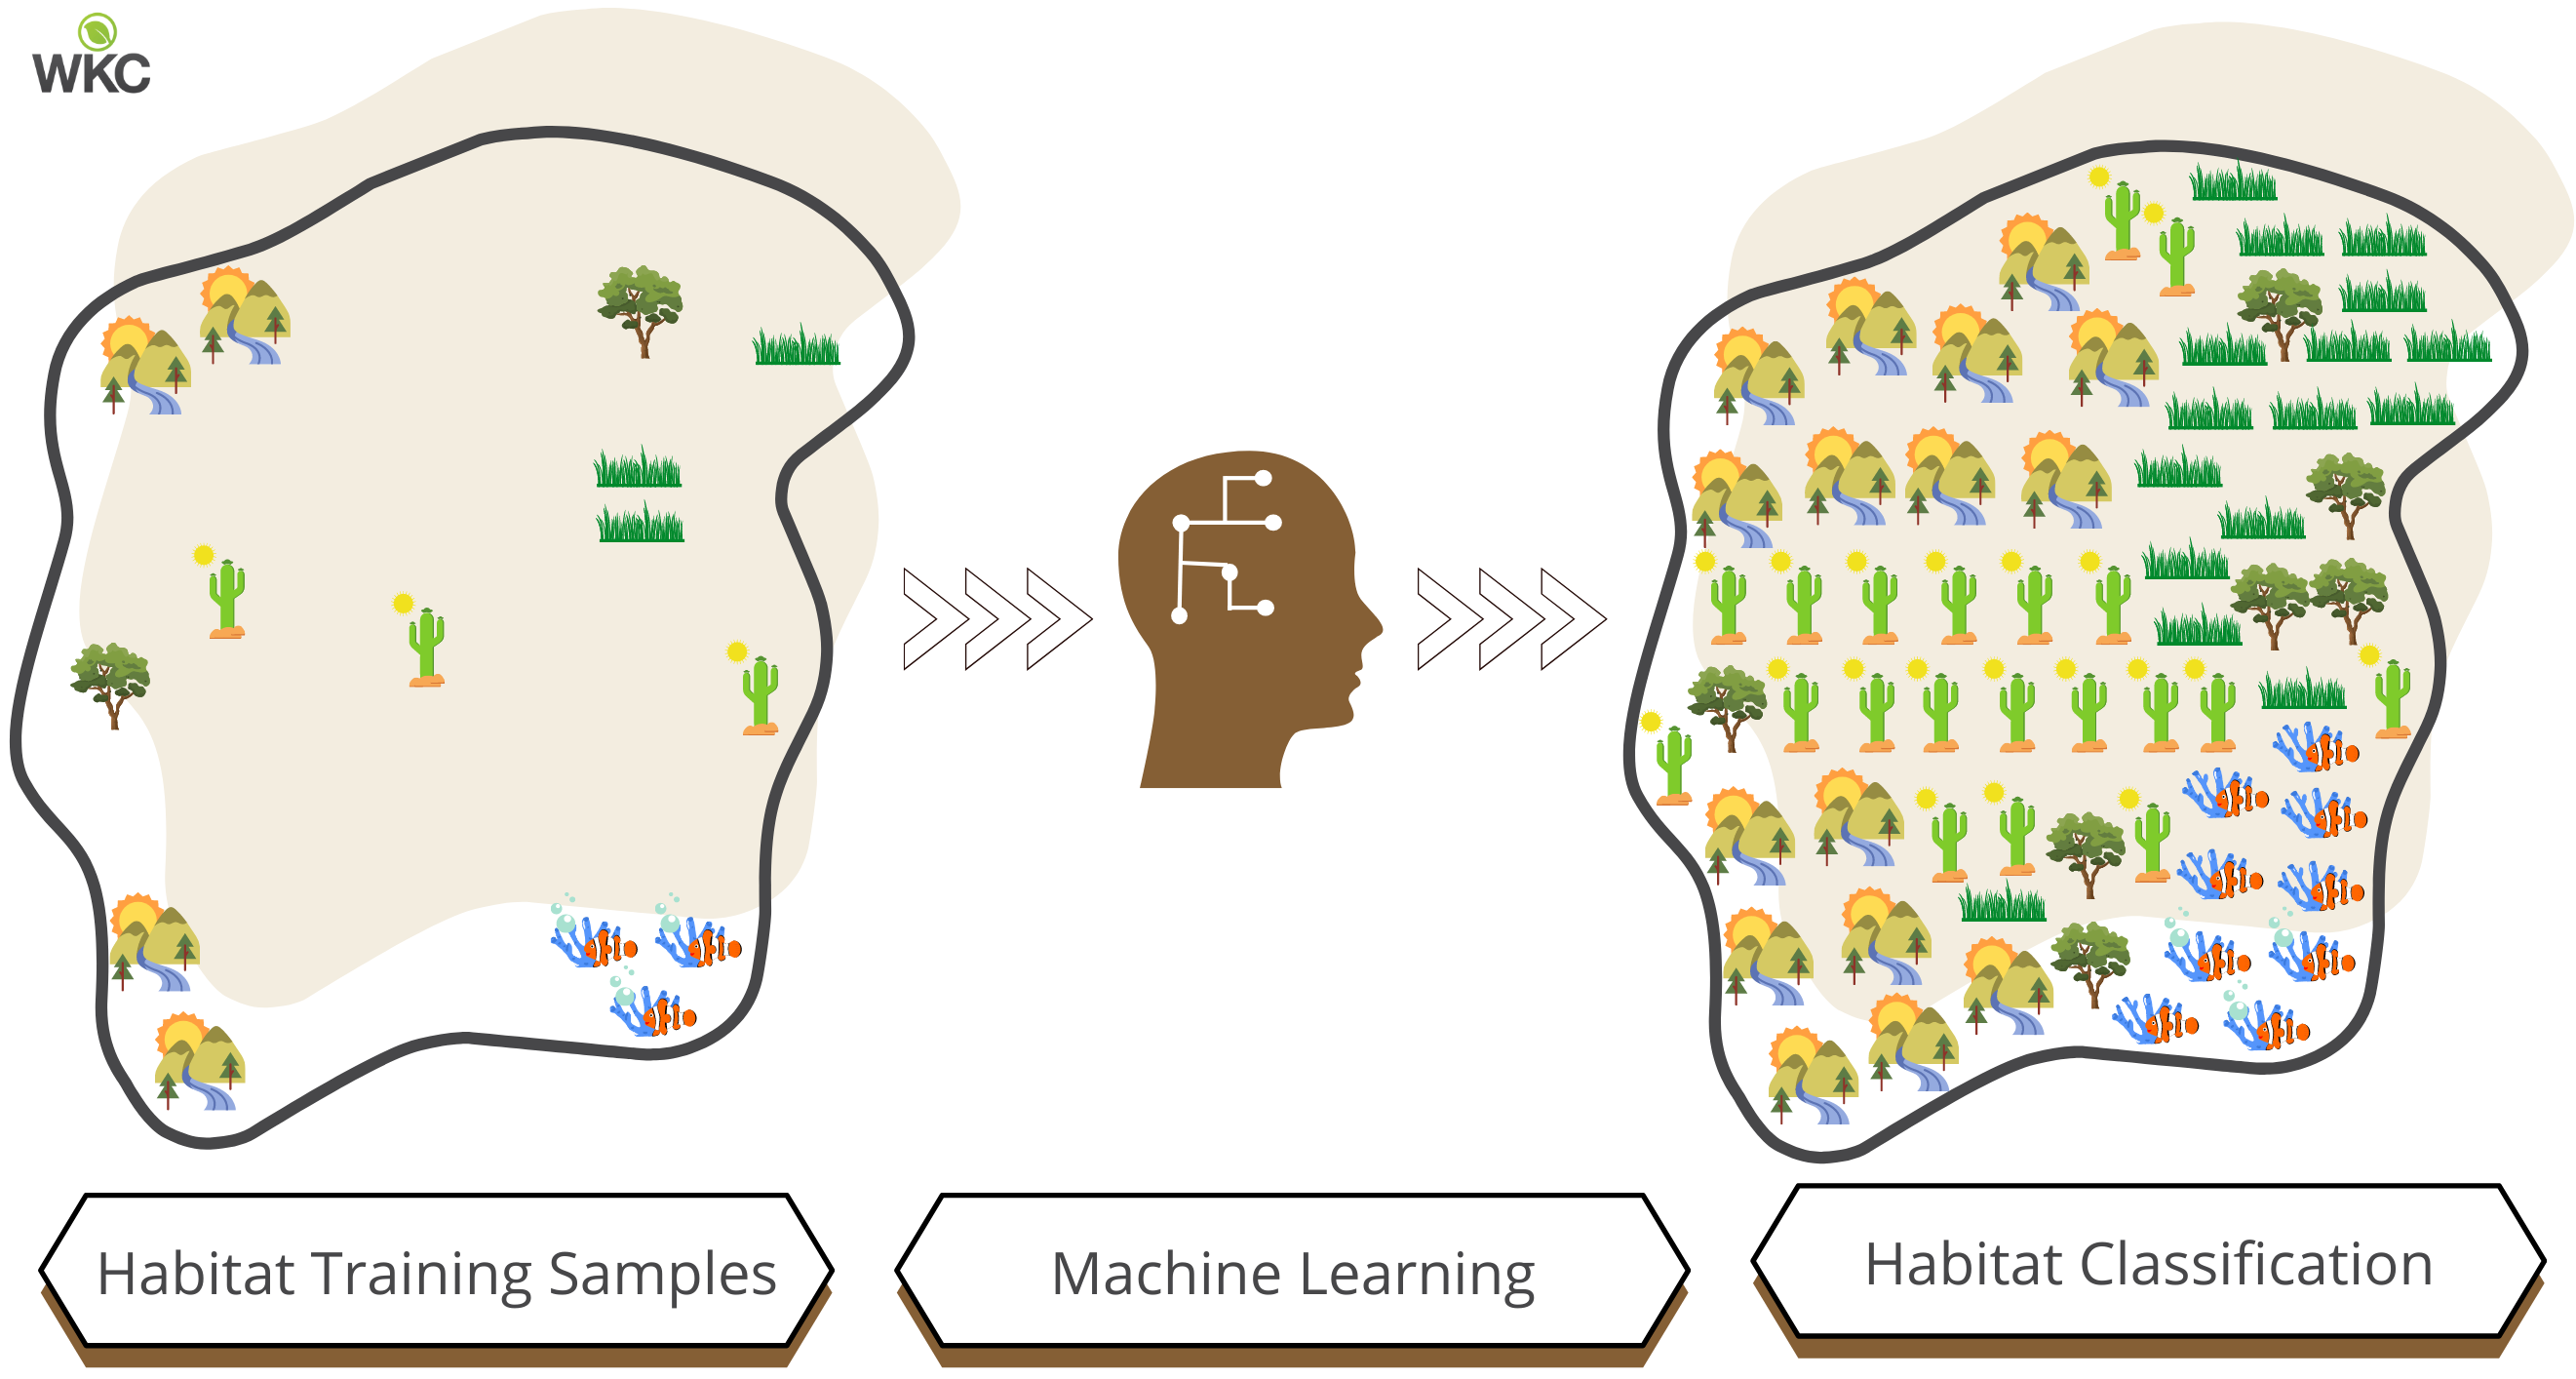
Simplified machine learning process for habitat mapping using optical satellite imagery.
(Click to view in full size)
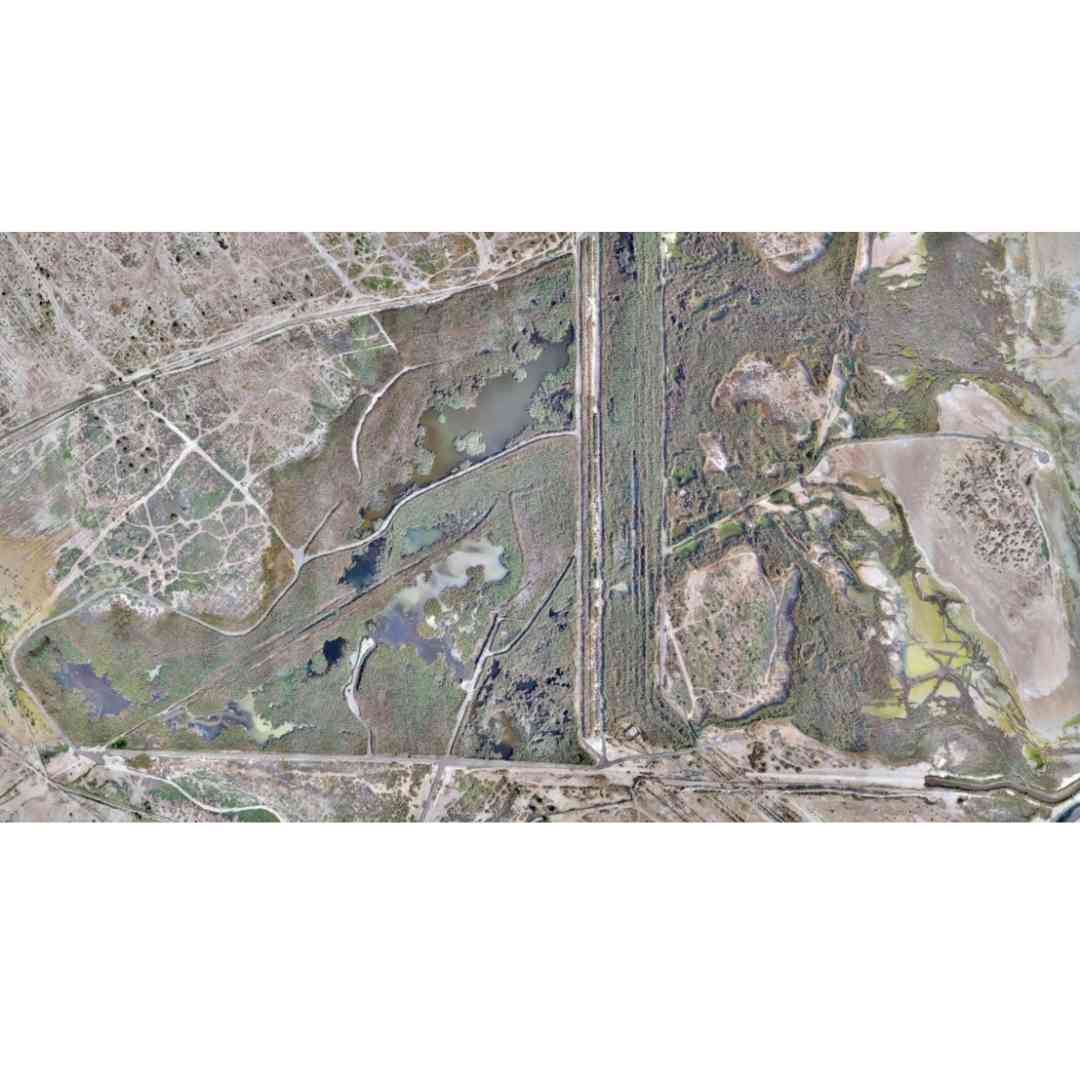
Habitats were mapped to 500m either side of the proposed route. An example of part of the route can be seen in the image below.
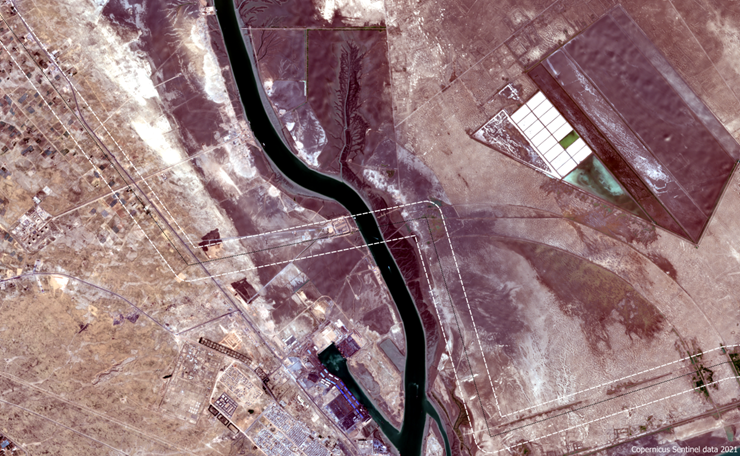
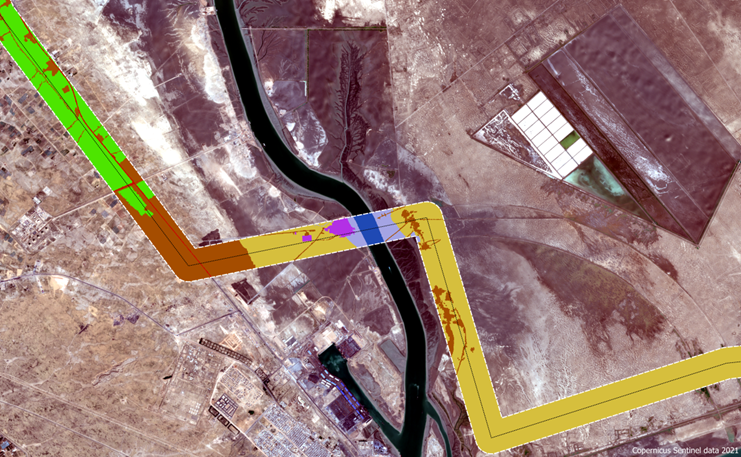
Use the slider bar to view satellite imagery with part of the proposed OHTL route before and after habitat classification has been carried out.
Drones
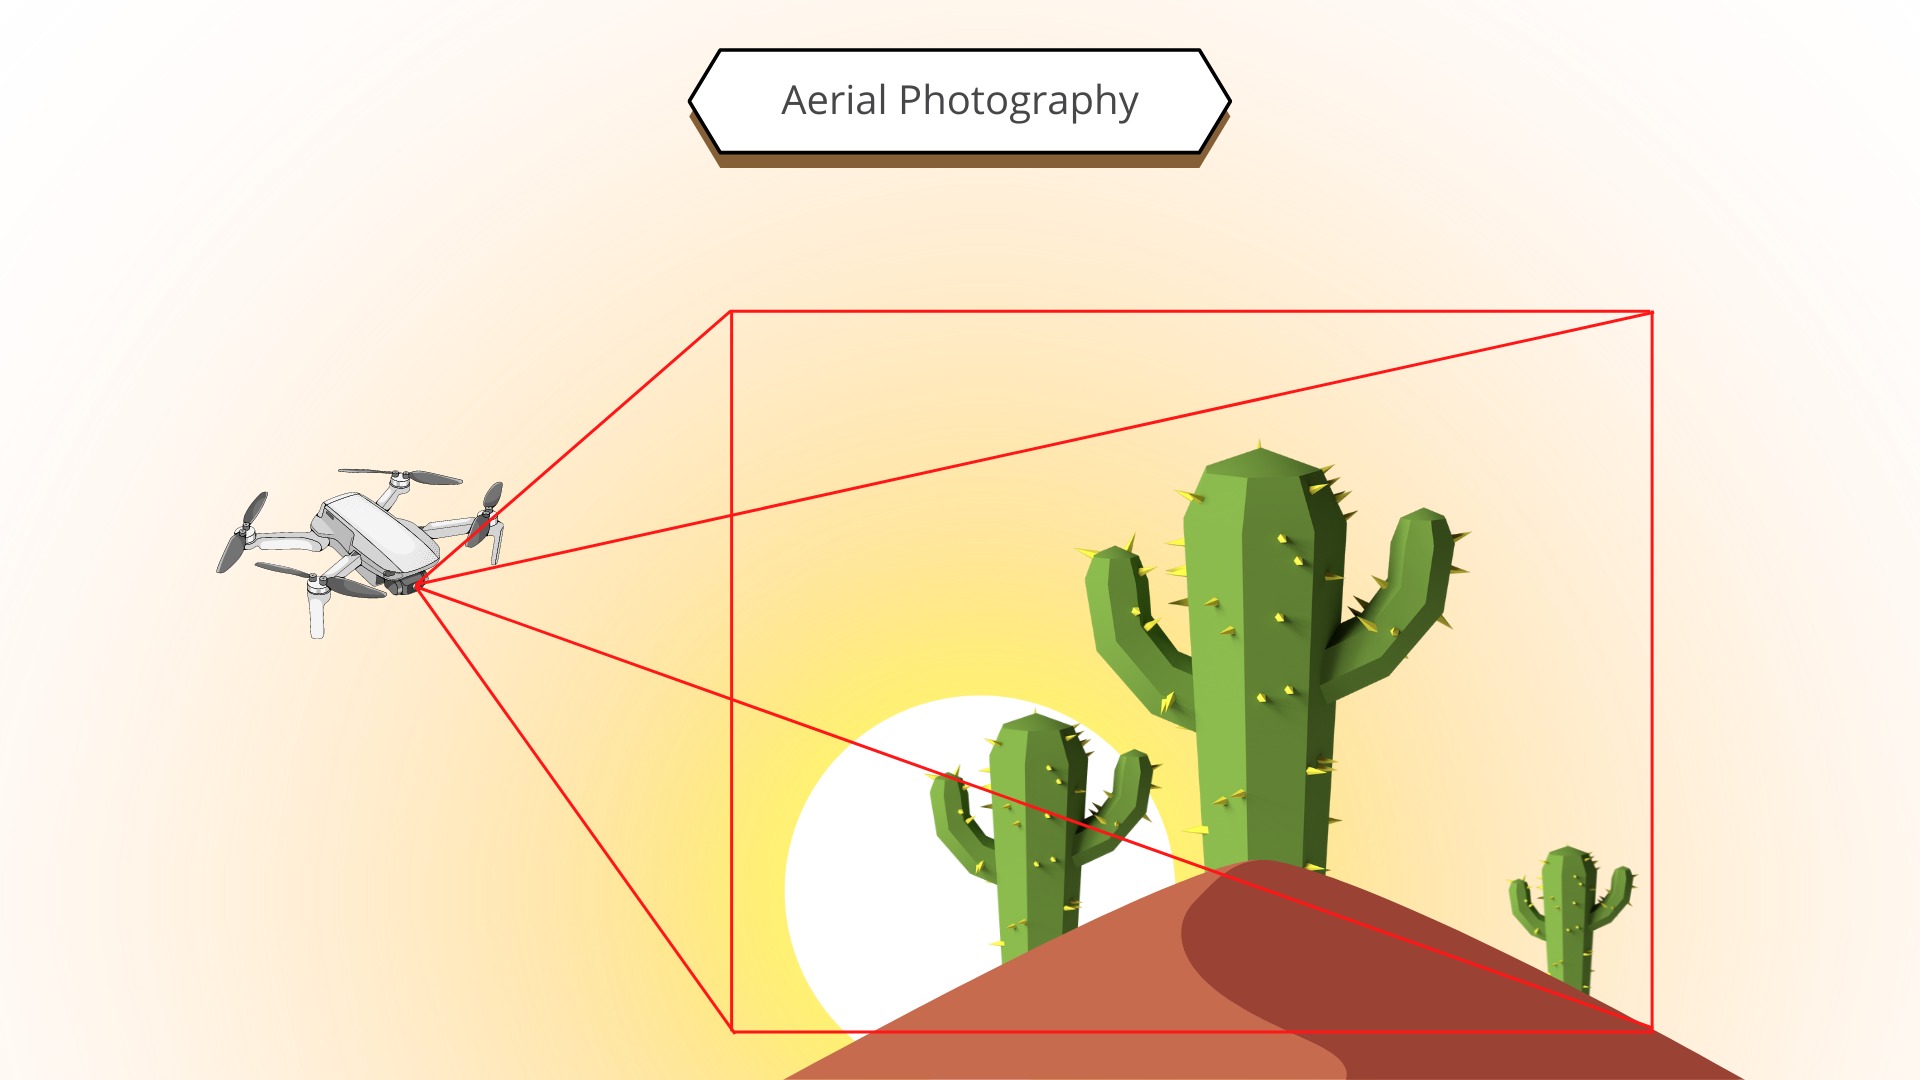
A key part of this ESIA was the integration of drone technology. Drones were used in two ways. One way was for aerial photography. This is useful to get a ‘birds eye view’ of the surrounding terrain along the route of the proposed OHTL.
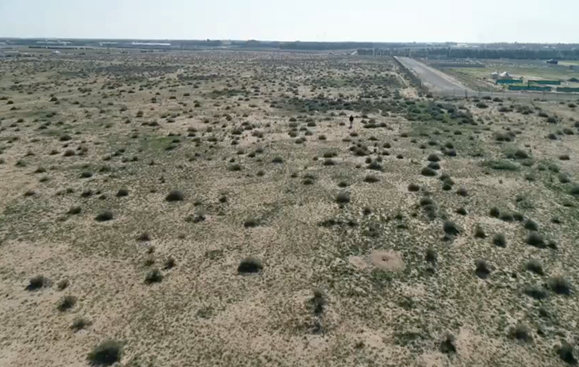
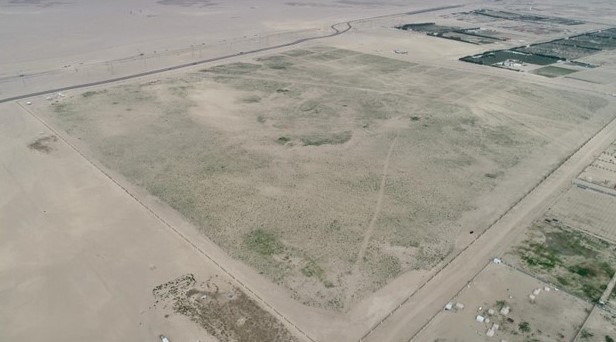
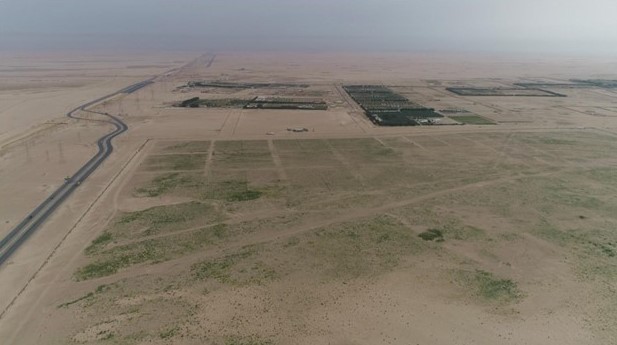
Drone aerial photography along the proposed OHTL route
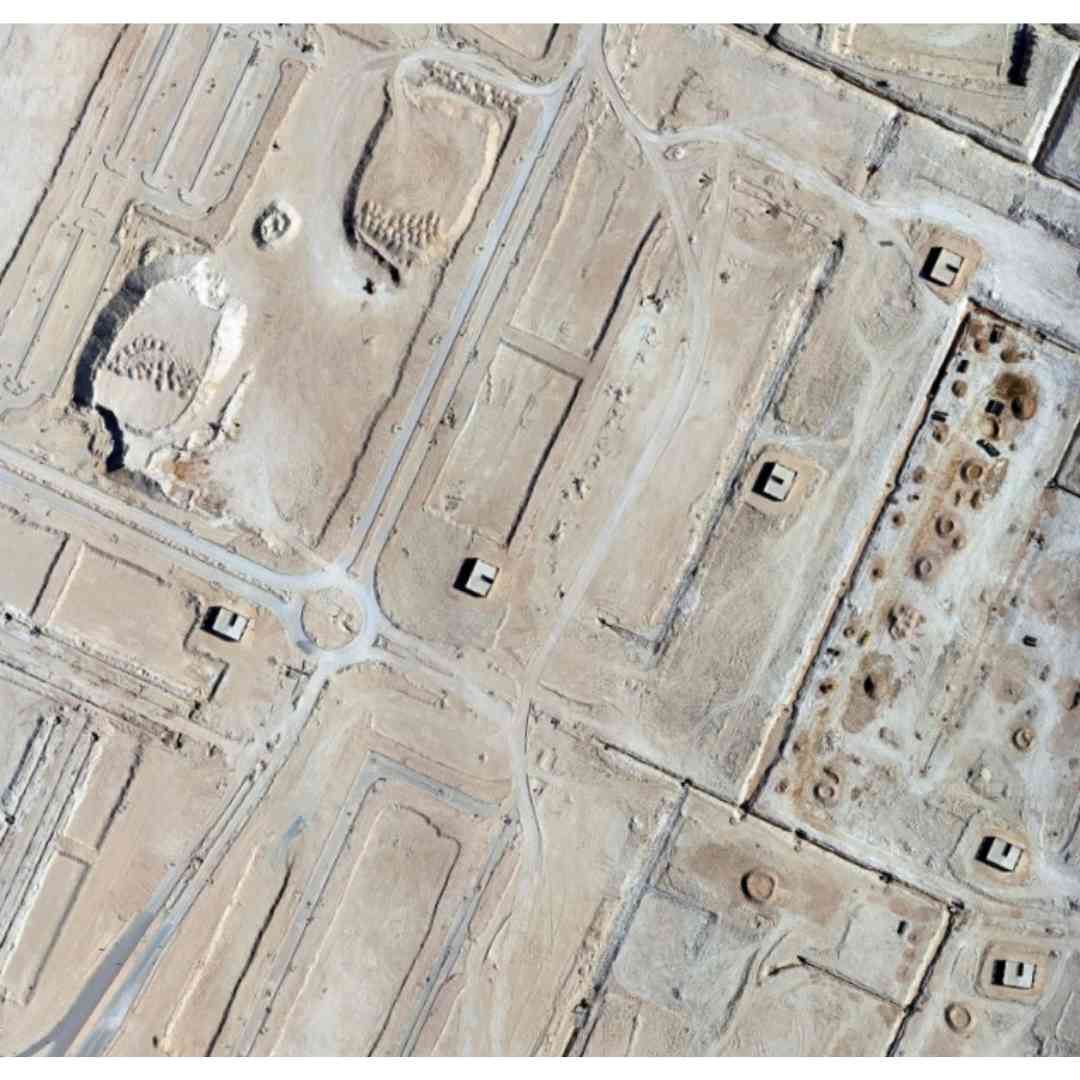
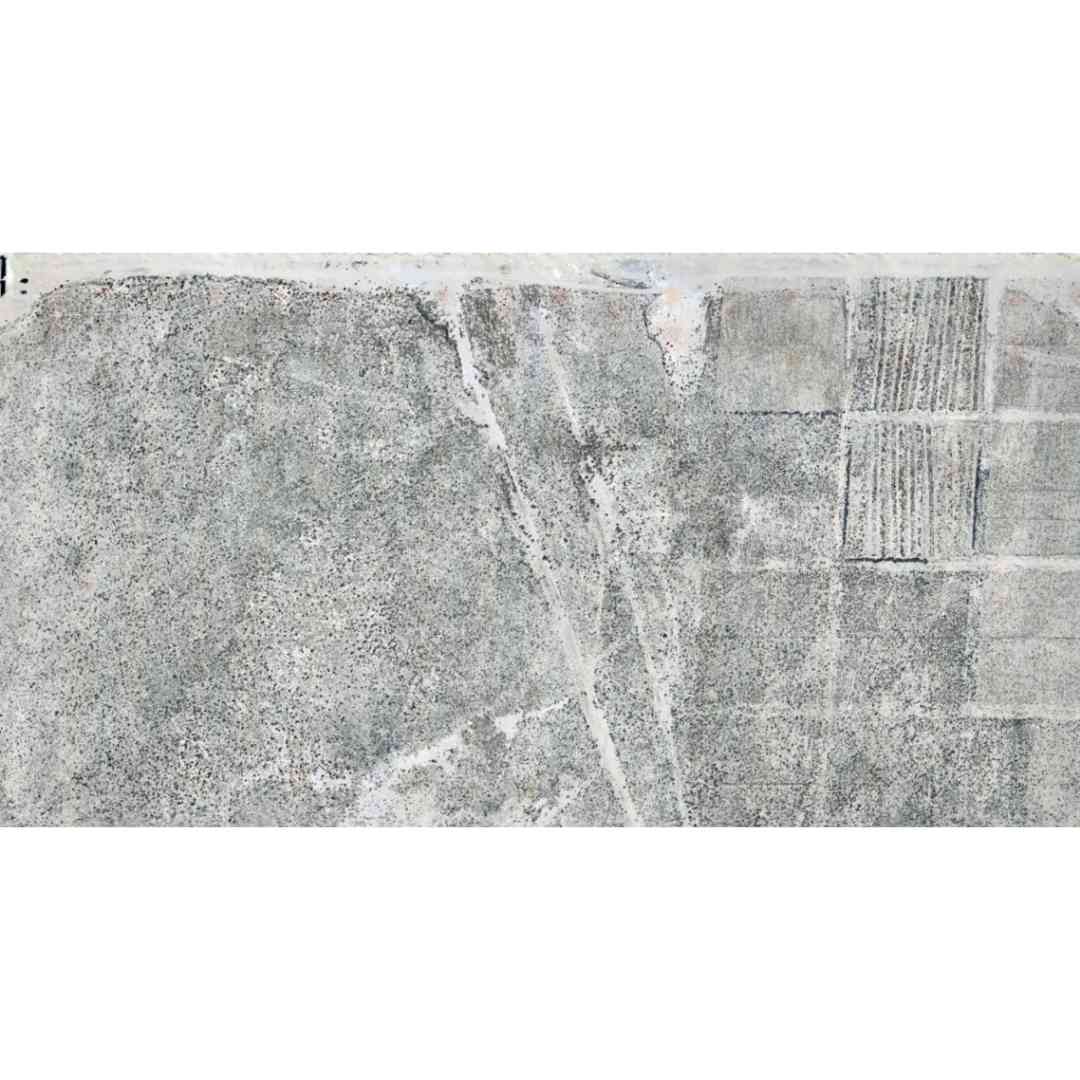
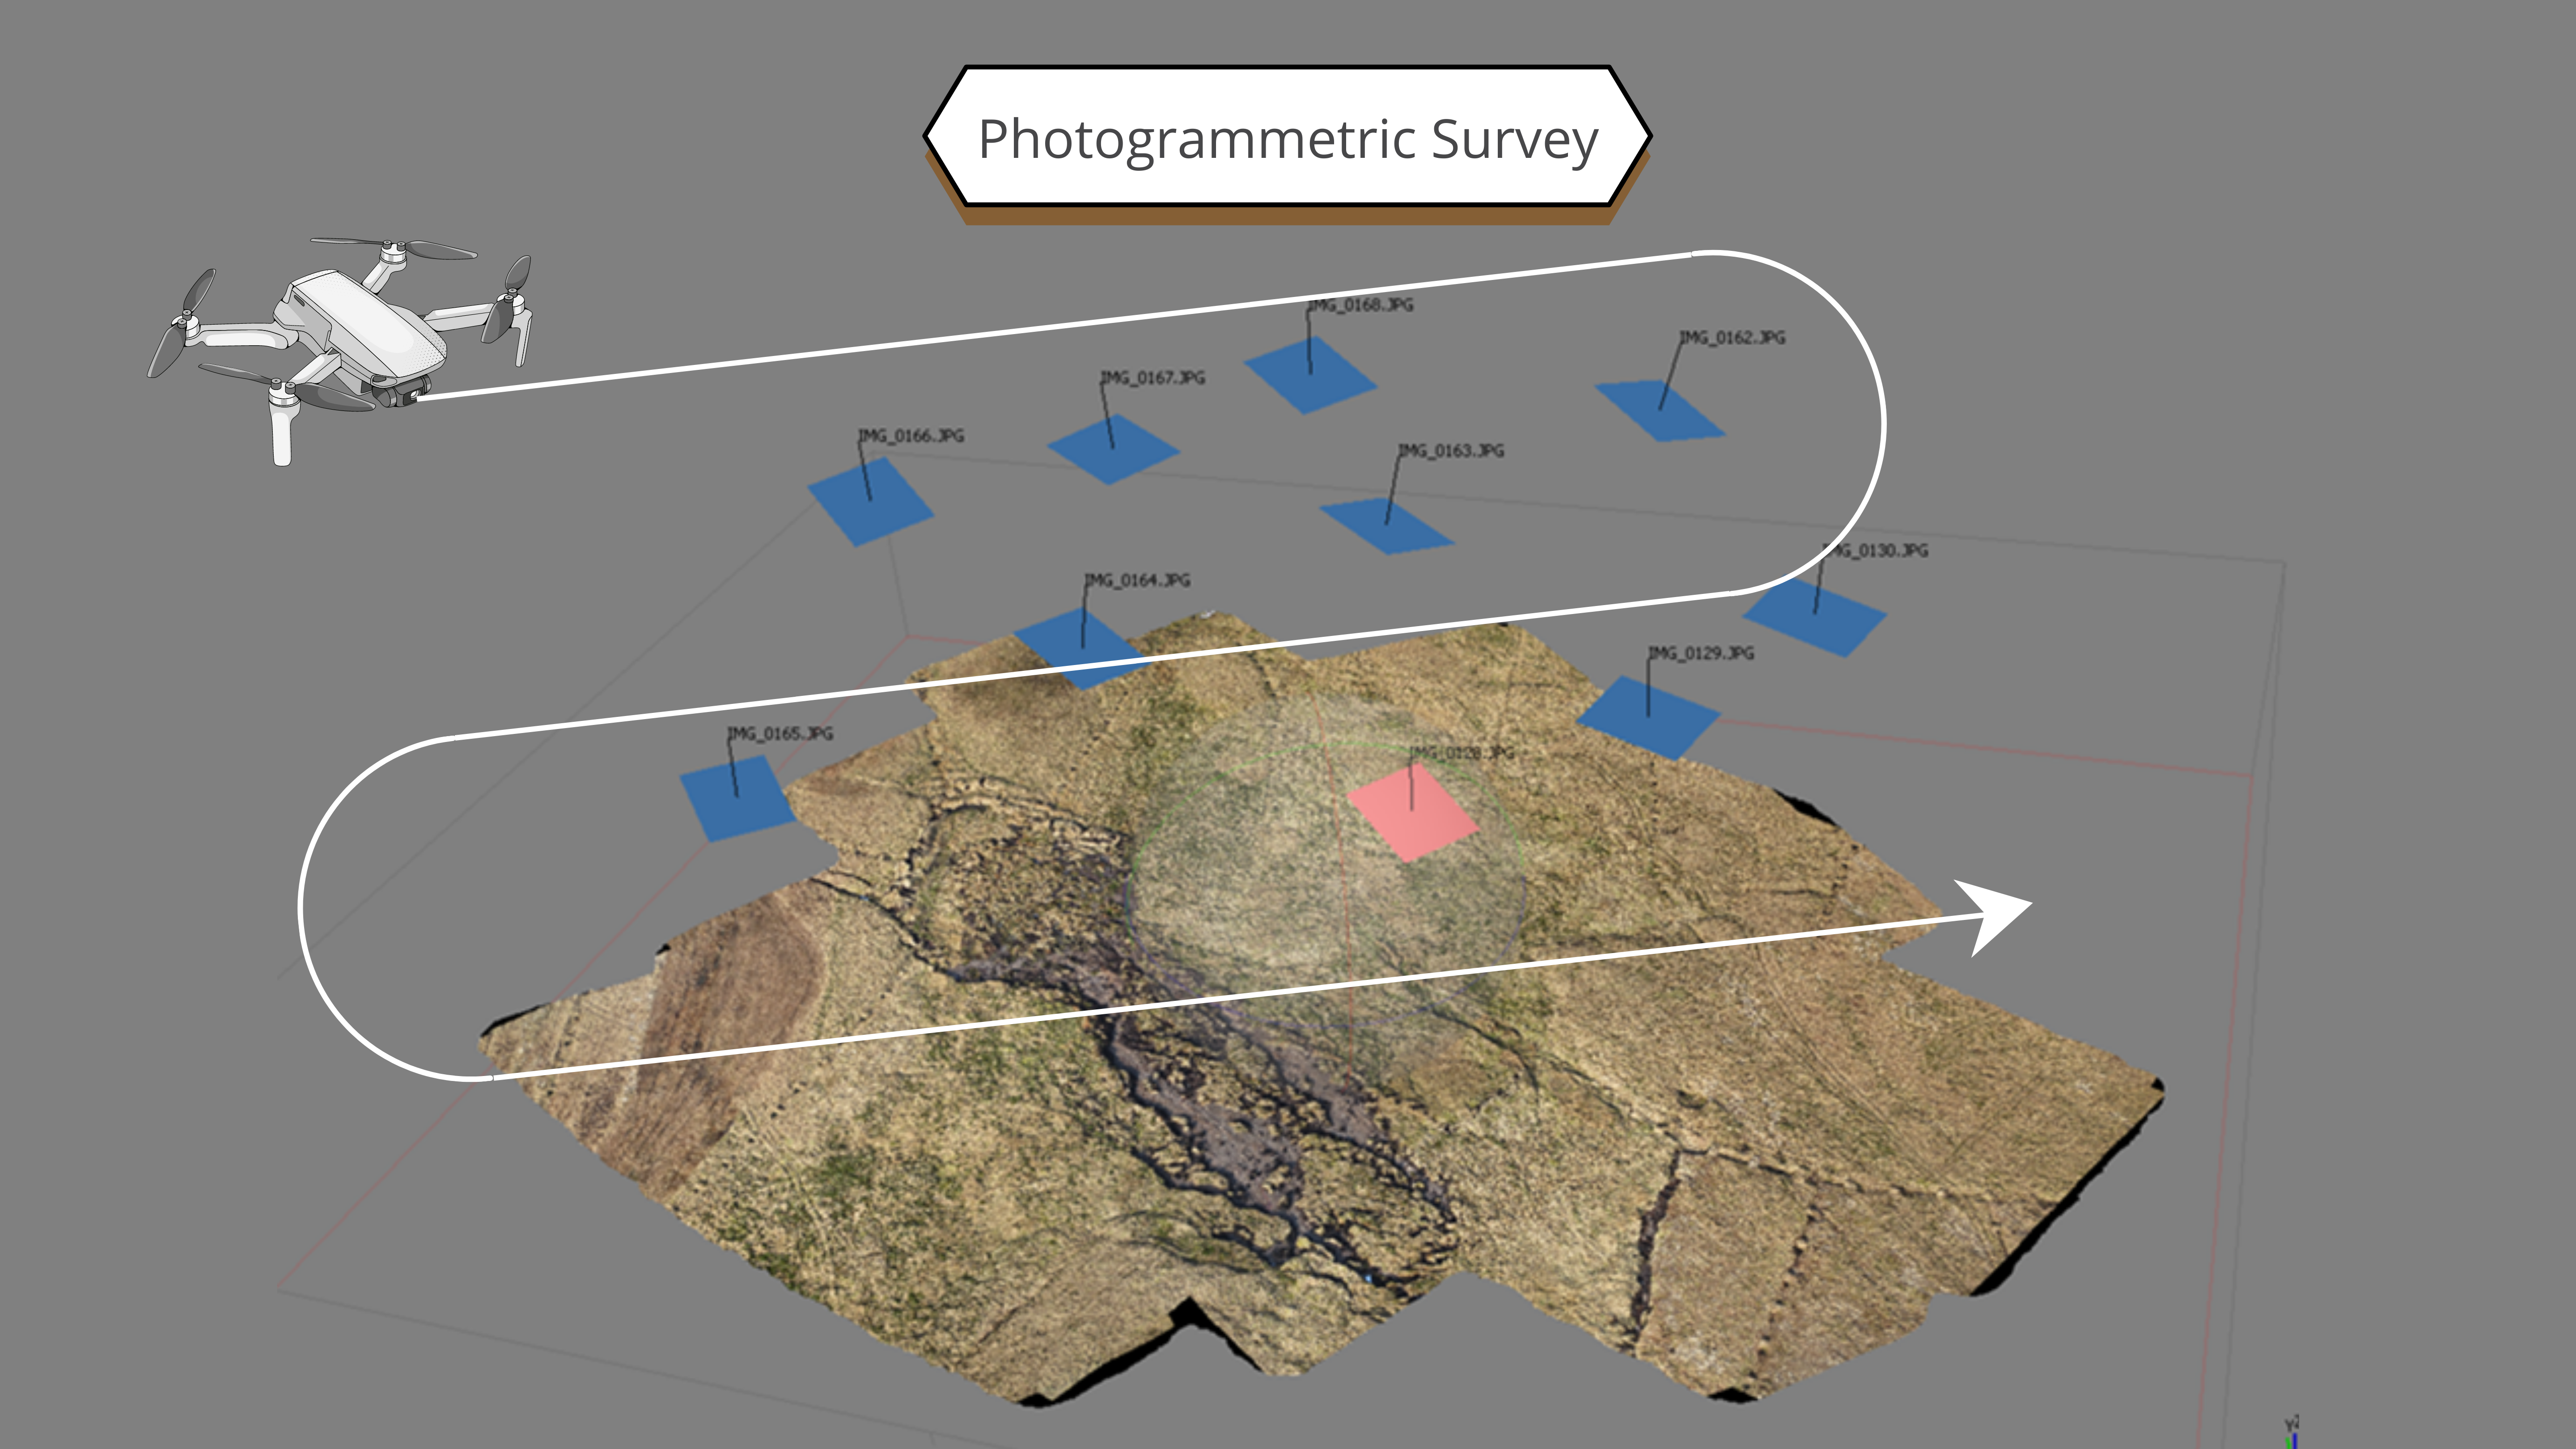
The other was to use the drone for photogrammetric survey. Here instead of capturing oblique imagery at an angle the drone captures nadir imagery, i.e., imagery facing straight down. The drone is pre-programmed to follow a set flight path capturing hundreds of photographs as it flies along. The photos are then processed within specialist photogrammetric software that stiches all the images together into one big orthomosaic.
The result is similar to that which you would see in Google Earth but may times more detailed. For example, the imagery here was processed with a spatial resolution of up to 2cm, i.e., each pixel that makes up the image is 2cm in size. In comparison the satellite data used for the habitat mapping has a spatial resolution of 10m.
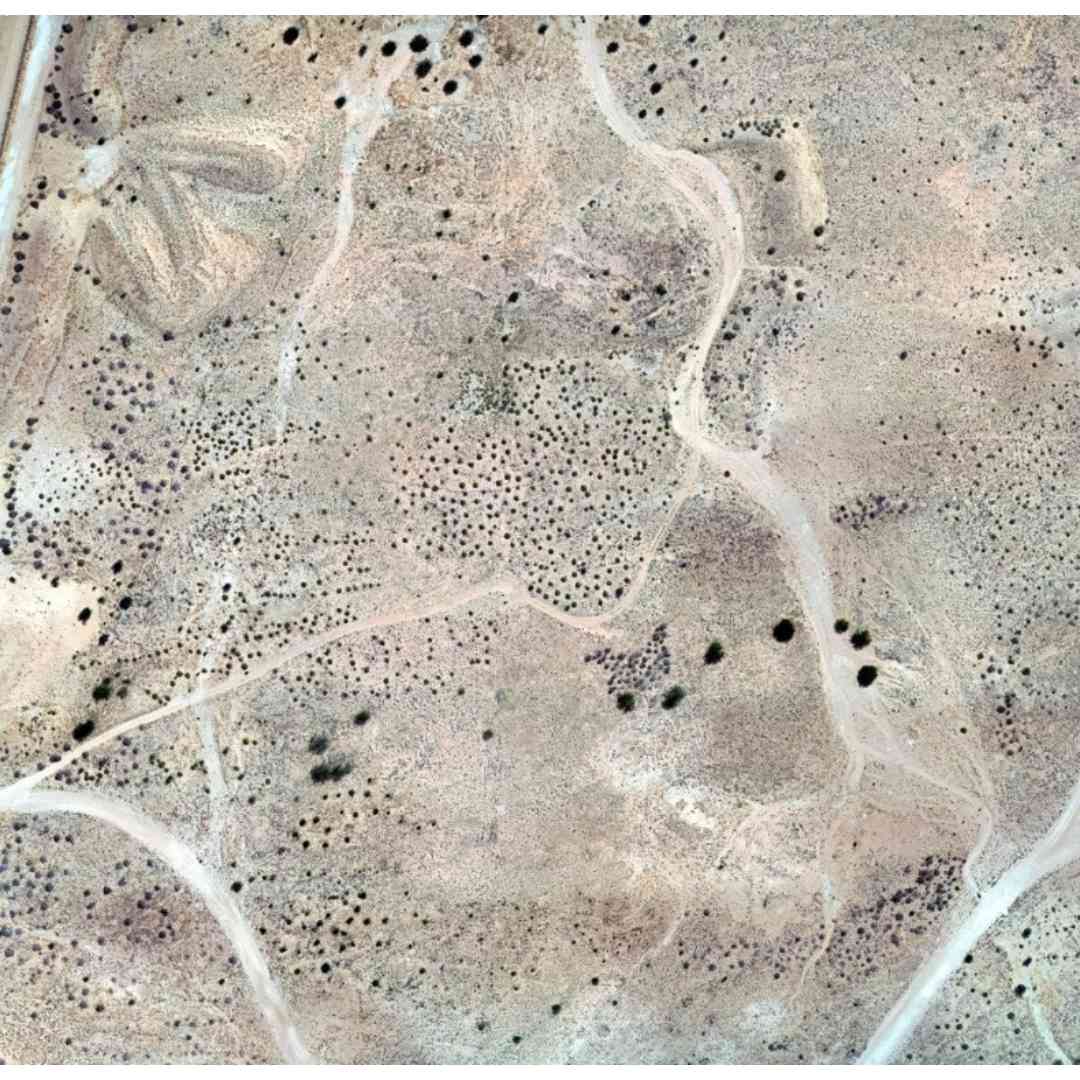
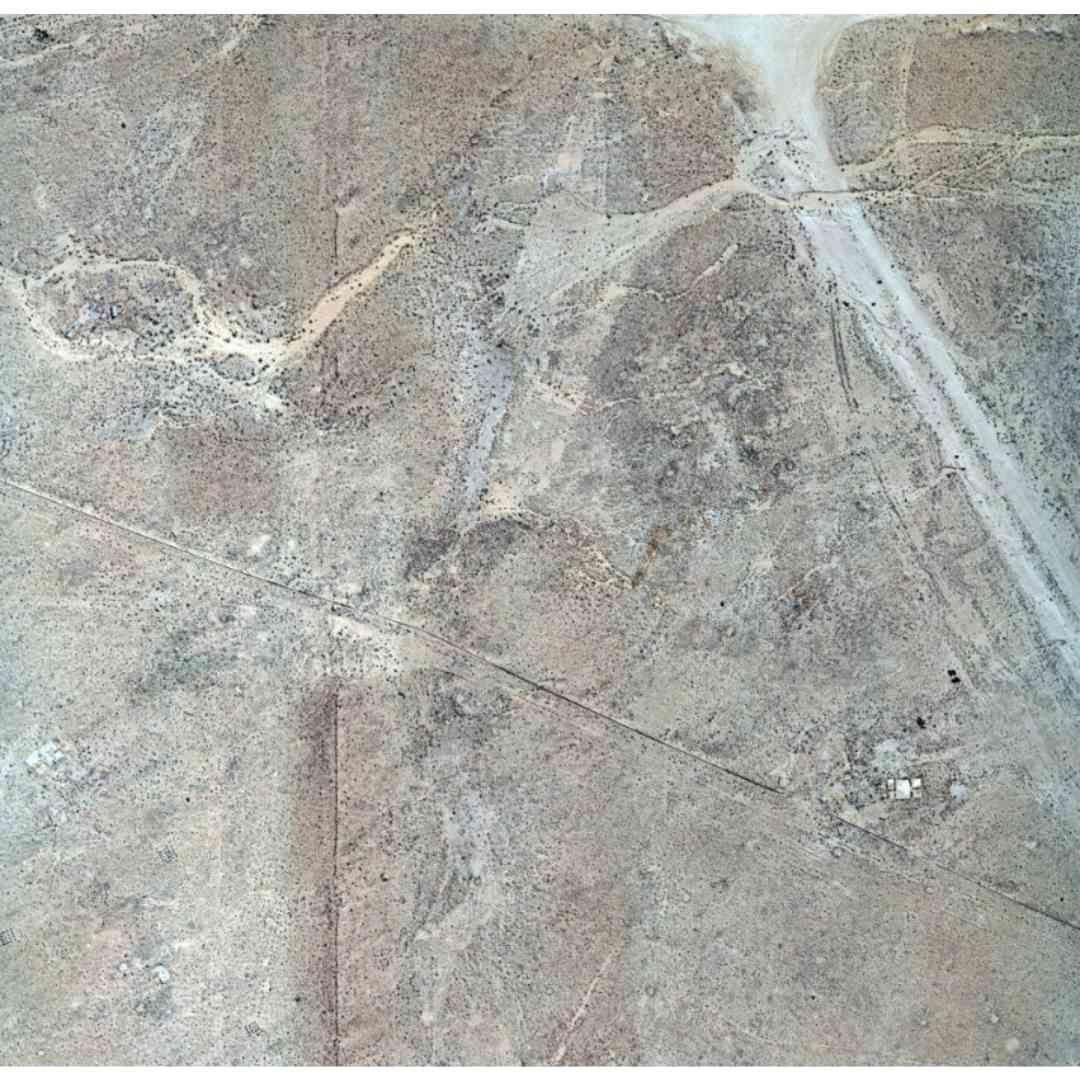
Examples of different habitat types captured during the drone surveys.
This imagery was used to ground truth habitats for the satellite-based habitat mapping. By being able to view the land cover in much greater detail than with the satellite imagery it was possible to gain greater insight into the habitats that are in specific areas along the proposed OHTL route.
Comparison of drone survey techniques
Time-series Analysis
In addition to environmental aspects when carrying out an ESIA, social aspects must also be taken into consideration. Examples of this include dwellings, places of recreation, places of employment and community facilities. If the construction of an OHTL on this scale goes ahead, how will it impact people? Will the proposed route need to be changed or can mitigation be put in place to minimise impact?
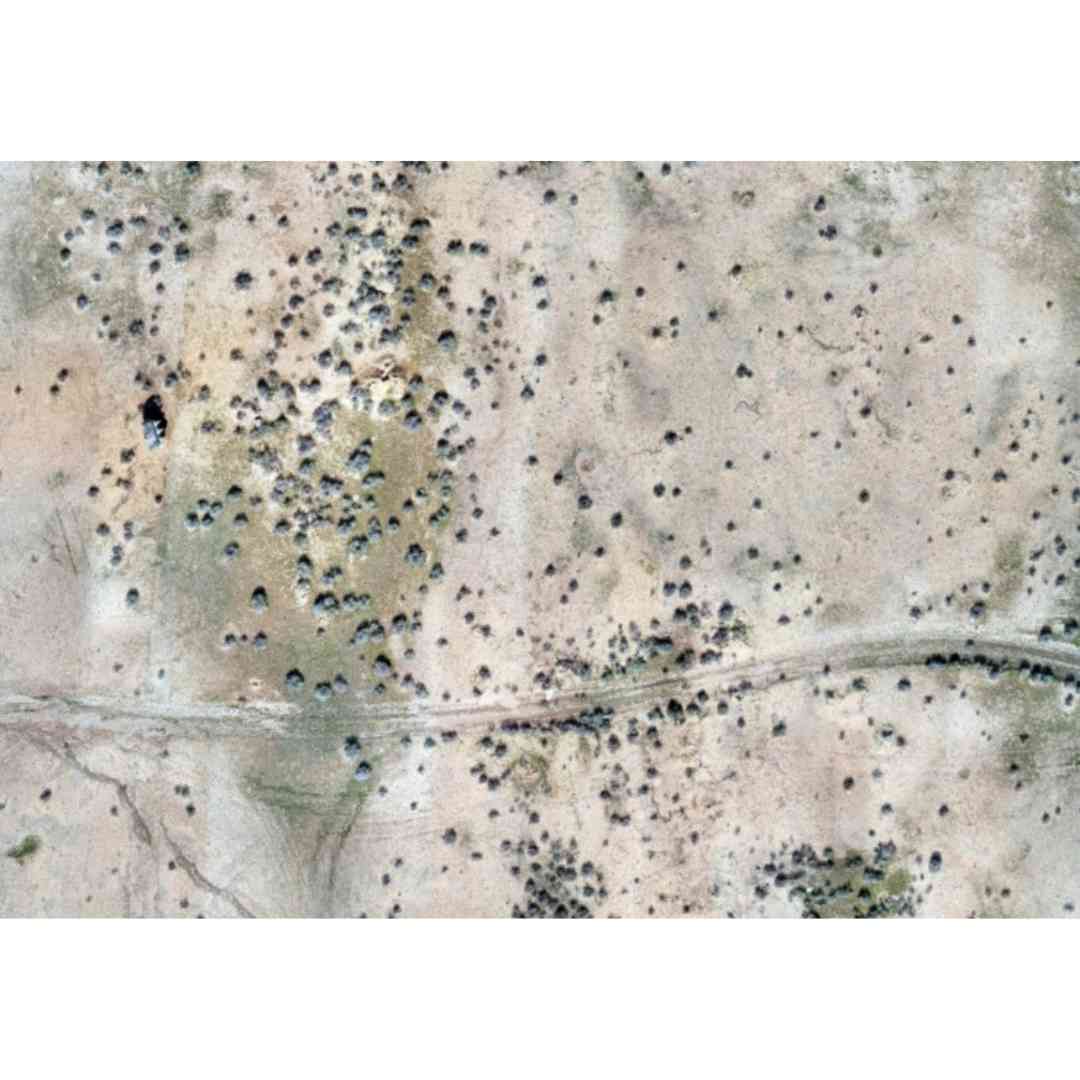
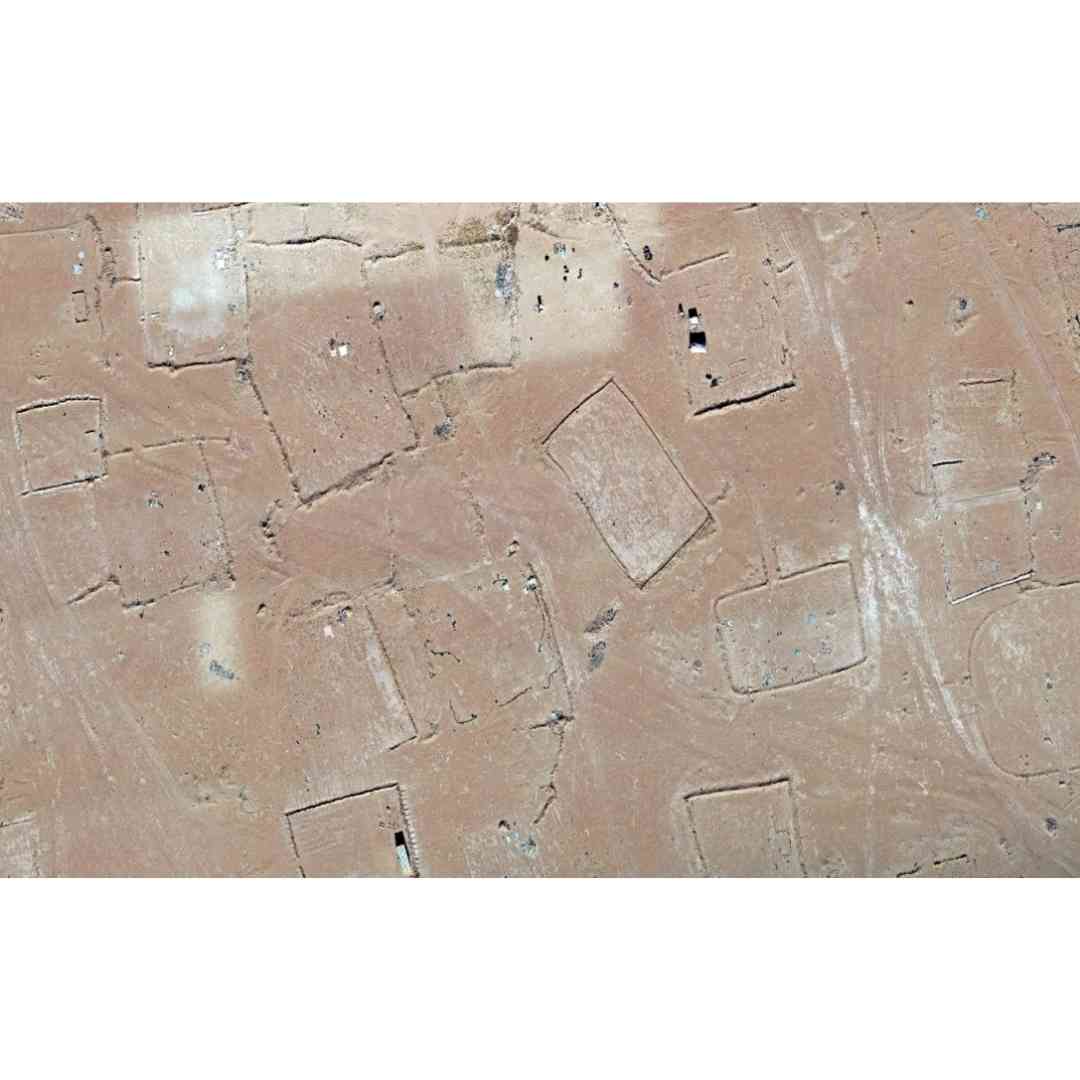
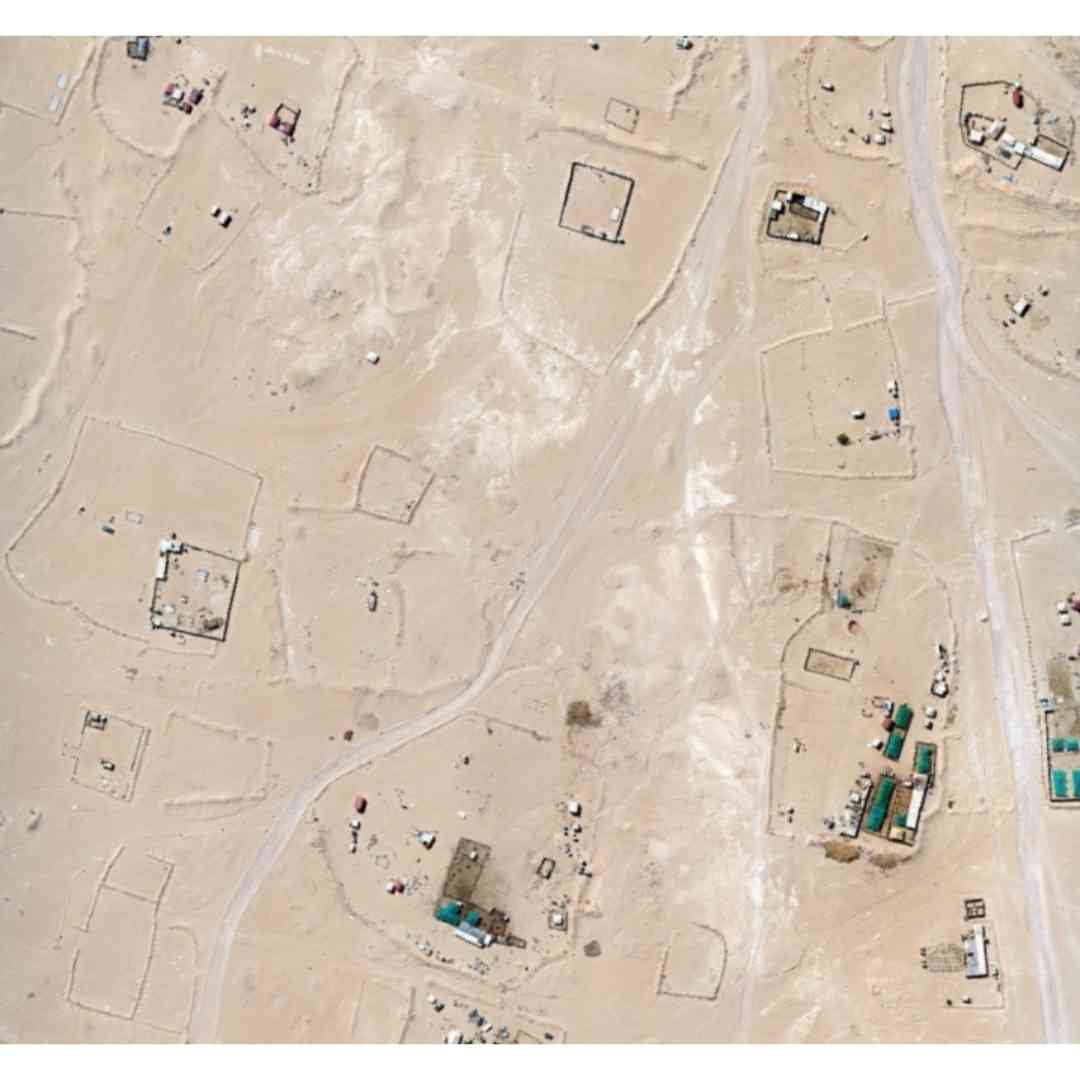
On reviewing satellite imagery for the proposed route there was at first what appears to be settlements near or within close proximity. After consultations with in-country consultants it was found that these were encampments belonging to nomadic livestock grazers. To investigate this further and to ensure that these weren’t permanent dwellers a time series analysis using satellite data was carried out.
This was done by digitising the outlines of encampments over several years using historic satellite imagery. It can be clearly seen how encampments come and go over the years.
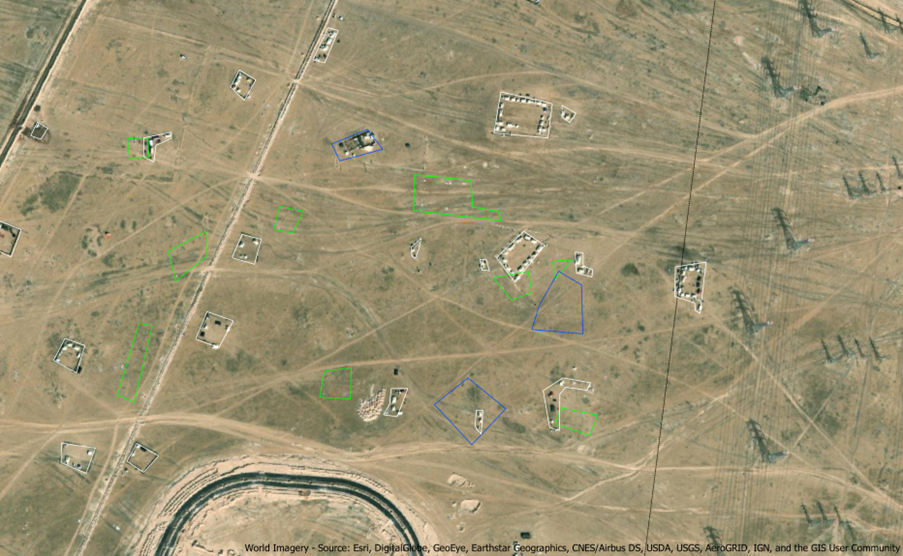
Time series analysis of nomadic grazer encampments.
To help us further understand these encampments and with the permission of the livestock farmers drone surveys were carried out to capture information in greater detail. This information helped us to understand the camps in context and we were therefore able to manage Project risks whilst safeguarding the farmers ability to graze their livestock.
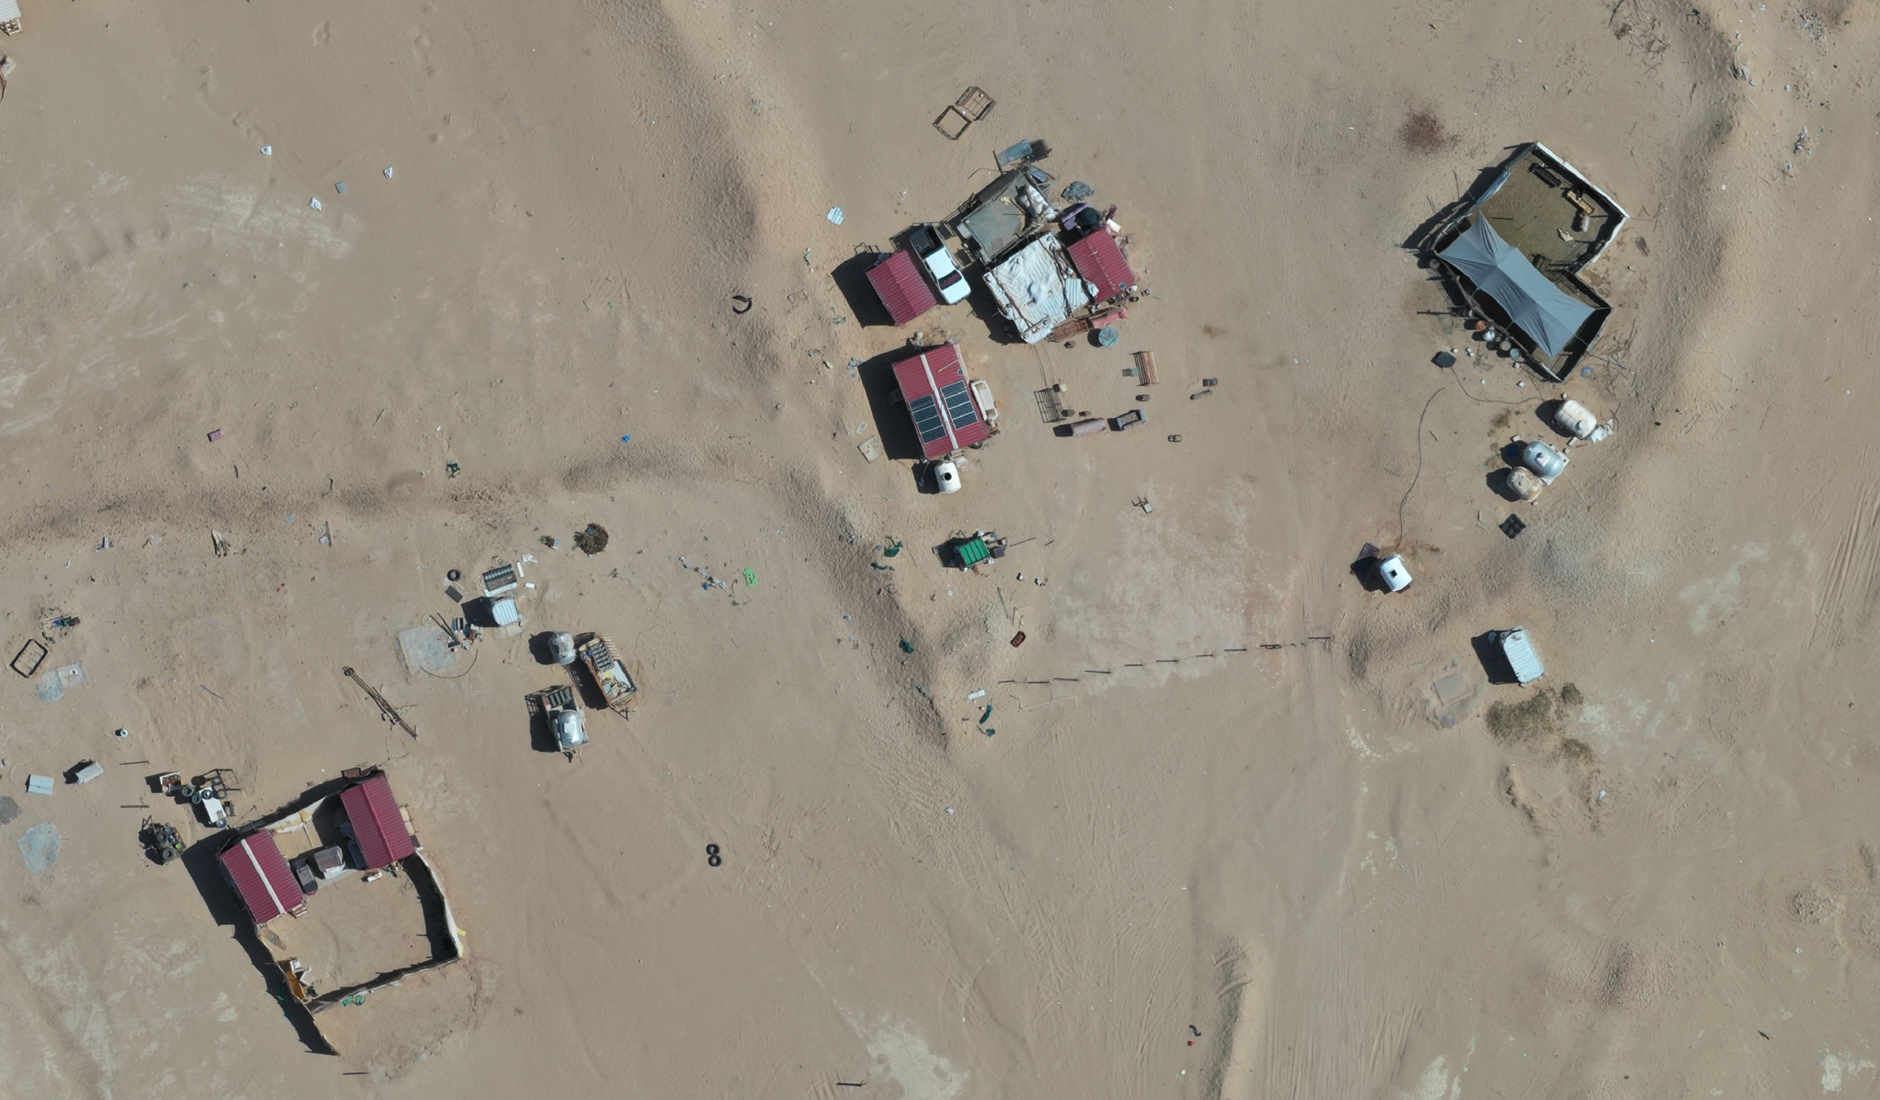
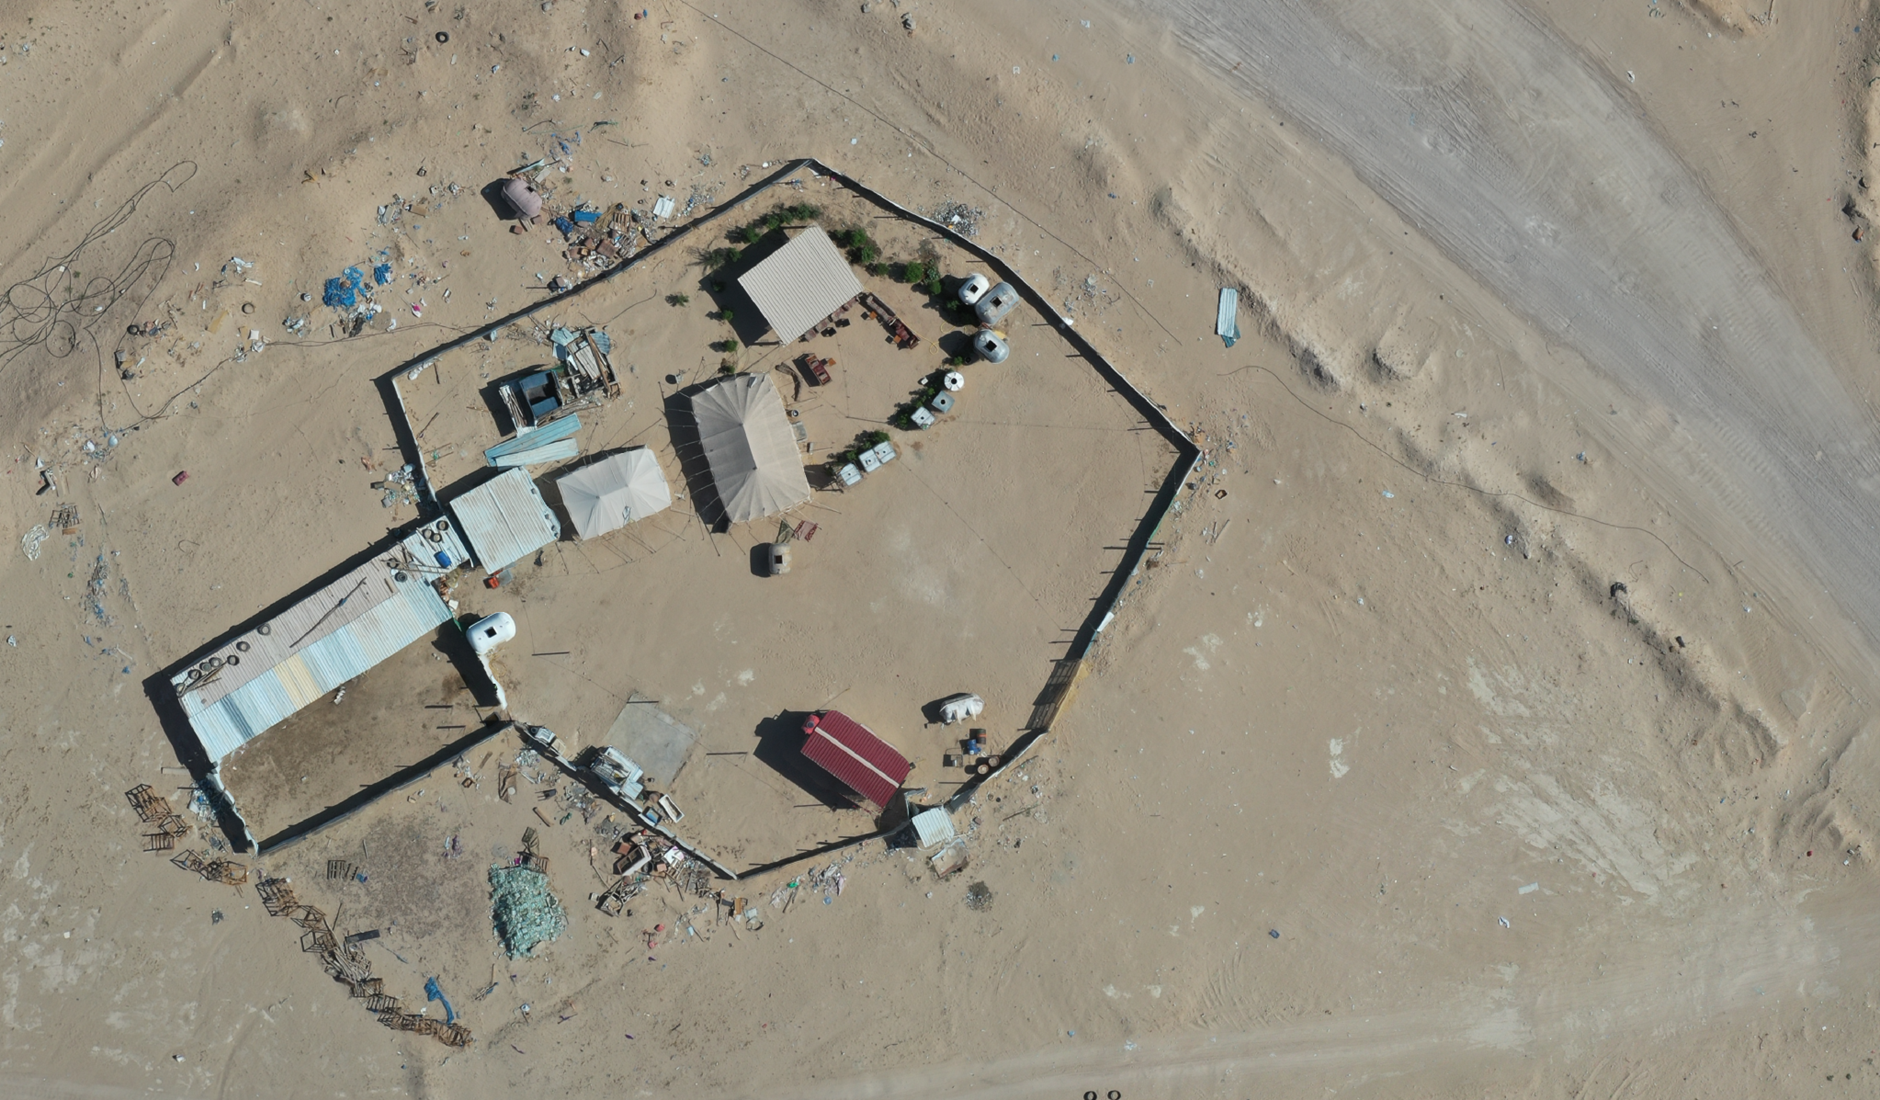
Drone surveys of nomadic grazer encampments.
From the use of satellites to drones, global positioning systems (GPS) and rugged field survey tablets, photogrammetry, machine learning and data science, WKC offers a refreshingly modern approach to their environmental consultancy work. Contact us to find out more about WKC’s GIS and Remote Sensing capabilities.