How to Quantify Carbon Capture Using Remote Sensing
By Mark Brown, WKC Group
An important requirement for calculating carbon capture in ecosystems at a specific site is acquiring the area and/or volume of the ecosystem that is being investigated.
Typically, this can involve a range of geospatial technologies such as satellites, drones, and light detection ranging (LiDAR), combined with Geographical Information System (GIS) software.
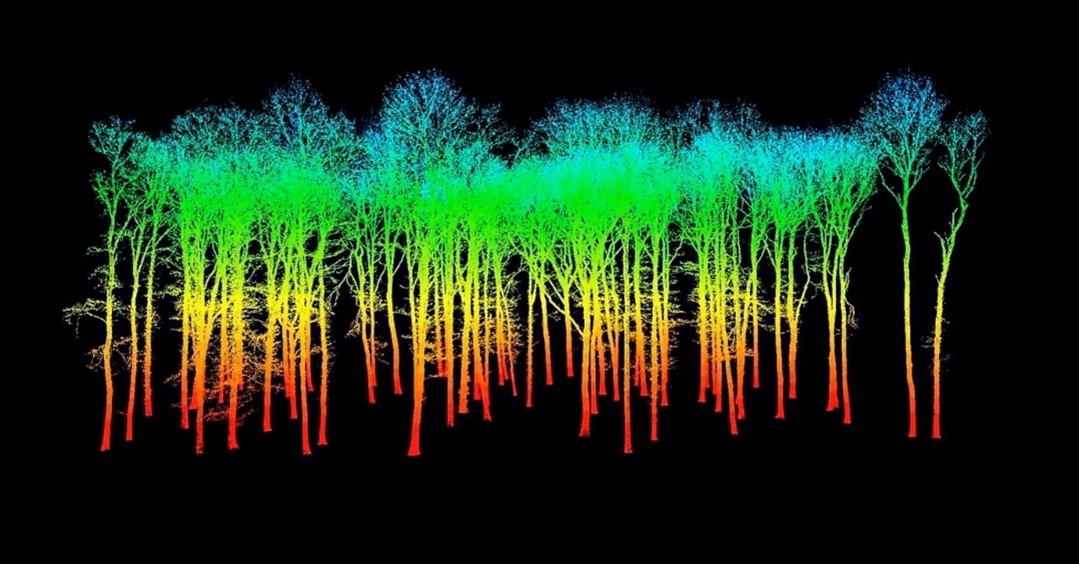 Terrestrial LIDAR scan of an area of forest
(Source: Terrestrial laser scanners of an area of forest)
These technologies enable information about specific ecosystems to be captured far quicker, over much wider areas, and with far greater accuracy, than if the information was to be captured exclusively by field team surveys.
How can satellites be used to estimate carbon capture?
Sensors on board satellites orbiting the earth collect information from the earth’s surface. Data can be collected in several ways from the traditional colour imagery that you might be most familiar with, through to use of lasers and radar.
Earth Observation satellites capture information from varying wavelengths of the electromagnetic spectrum. This includes spectral bands such as Red, Blue, Green, Vegetation Red Edge, Near Infra-Red (NIR), Short Wave Infra-Red (SWIR), Coastal Aerosol, Cirrus and Thermal Infra-Red.
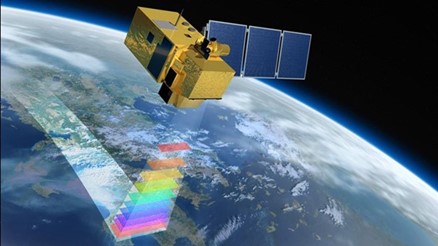
Earth Observation Satellite (Credit: European Space Agency)
Different land surfaces and vegetation types absorb and reflect light in different ways. By analysing the spectral properties of features on the earth’s surface it is possible to classify the features into discrete areas. This information can then be extracted to give the extent of different habitats and ecosystems.
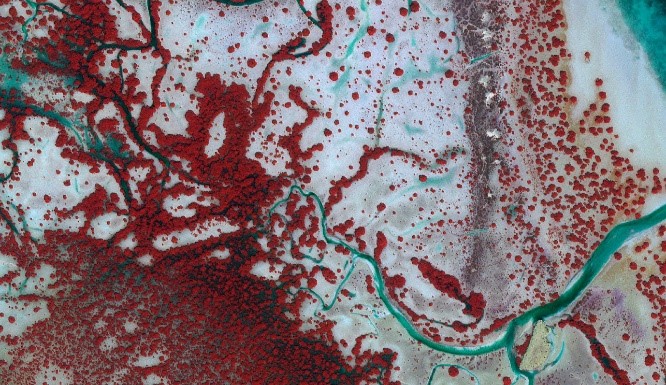
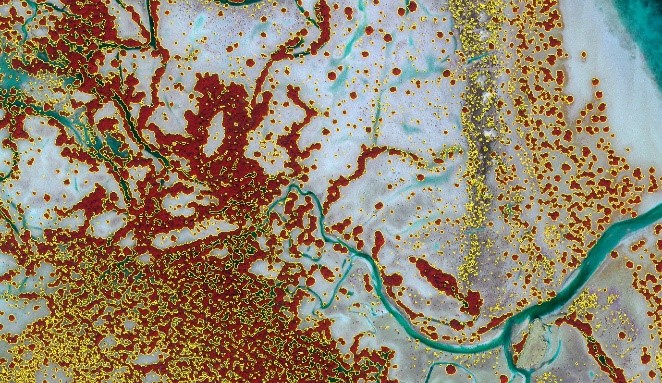
Automated mapping of coastal mangrove forest in the United Arab Emirates for carbon capture calculations. The mangroves appear as bright red as this is a False Colour Infra-red (Near Infra-Red, Red, Green spectral band) composite of high-resolution multispectral satellite imagery. Vegetation strongly reflects infrared light; hence the mangroves appear red in this composite image. © Mark Brown
How can drones be used to estimate carbon capture?
Drone technology has rapidly evolved since the first commercially available drones appeared around 2010. Drones these days come in many shapes and sizes and can range in price from a couple of hundred up to millions of dollars. Drones are most commonly associated with aerial photography, capturing photographs from a bird’s eye view.
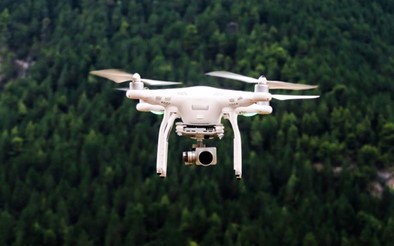
Multi-rotor drone used for aerial photography
However, drones can also be used for mapping purposes by mounting a sensor in a nadir position. This means that the images are shot with the camera axis straight below in a vertical position. Mapping drones can be equipped with a range of different sensors including multi-spectral sensors, hyperspectral sensors, thermal imaging, and LiDAR. There are several different types of drones including multi-rotor drones, fixed-wing drones, single-rotor drones and fixed-wing hybrid vertical take-off and landing (VTOL) drones. Drones capture data at a much higher resolution than satellite imagery which means ecosystems can be mapped at a much finer scale. Similar methods can be used to map habitats to that used to map habitats using satellite imagery.
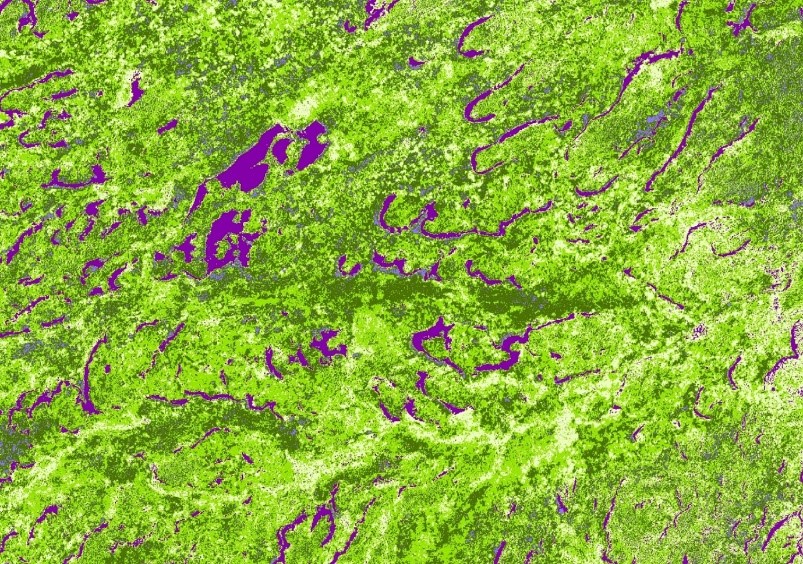
Fine scale habitat mapping of an area of blanket bog habitat in the United Kingdom (UK) © Mark Brown
Another advantage of using drones is that by using photogrammetric processing (Photogrammetry is the process of using overlapping aerial images to extract exact ground positions), high resolution topographic models of the earth’s surface can also be acquired.
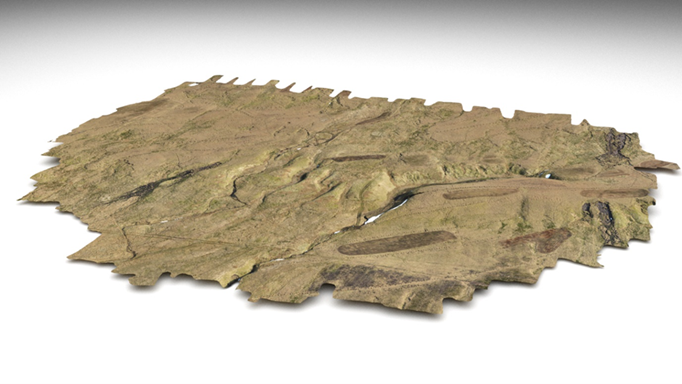
Photorealistic topographic model of an upland area in the United Kingdom (UK) © Mark Brown
Topographic models generated in this way can be used to model subsurface carbon reserves by combing the drone data with soil depth data captured manually in the field. For example, the image below shows computer modelled volume of sub-surface peat reserves. The model not only takes into account depth but also surface topography. This can be used to estimate the amount of carbon stored beneath the ground taking into account fine scale surface variation.
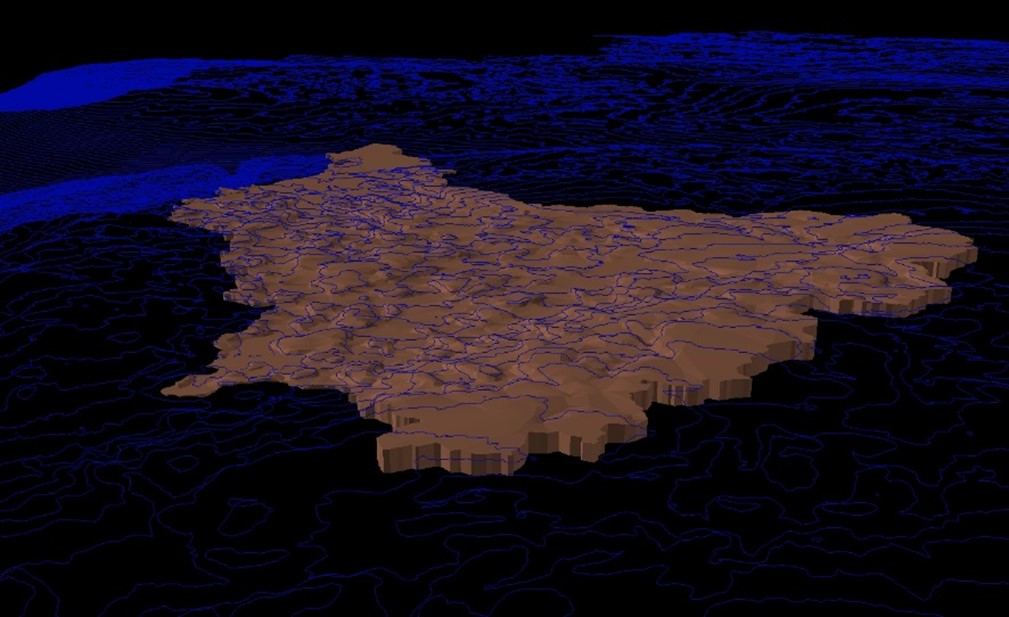
3D model of sub-surface peat reserves. © Mark Brown
How can LiDAR be used to estimate carbon capture?
LiDAR or light detection ranging is a remote sensing method that can be used to map vegetation structure including height, density, and other characteristics. LiDAR sensors can be found mounted on fixed wing aircraft, helicopters, ground based lidar scanners and even on satellites.
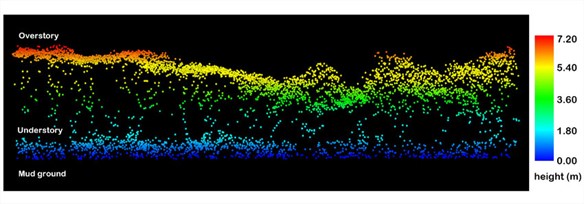
LiDAR point clouds visualised within GIS software
(Source: Temilola Fatoyinbo et al 2018 Environ. Res. Lett. 13 025012)
LiDAR is a type of remote sensing where light is emitted from a rapidly firing laser. The light travels to the ground and reflects off features on the surface. The reflected light then bounces back to the LiDAR system where it is recorded. The LiDAR system records the time it takes for the emitted light to travel to the ground and back. This combined with GPS and computer processing returns an easting (x coordinate), northing (y coordinate), and elevation (z coordinate) for each LiDAR point. This results in what is known as a point cloud that can contain hundreds of thousands of individual measurements.
Point cloud of mangrove habitat produced from LiDAR data
(Source: Li, Qiaosi et al. (2019). Classification of Mangrove Species Using Combined WordView-3 and LiDAR Data in Mai Po Nature Reserve, Hong Kong. Remote Sensing. 11. 2114. 10.3390/rs11182114.)
One way in which LiDAR can be used to estimate carbon content in trees is to create a canopy height model (CHM) to give a measure of biomass. Using computer processing tools LiDAR points can be classified into ground and top of canopy measurements. These points can then be converted into a Digital Surface Model (DSM) that takes into account all features on the earth’s surface, and a Digital Terrain Model (DTM) representing the earth’s surface with all surface features removed (also known as a bare earth model).
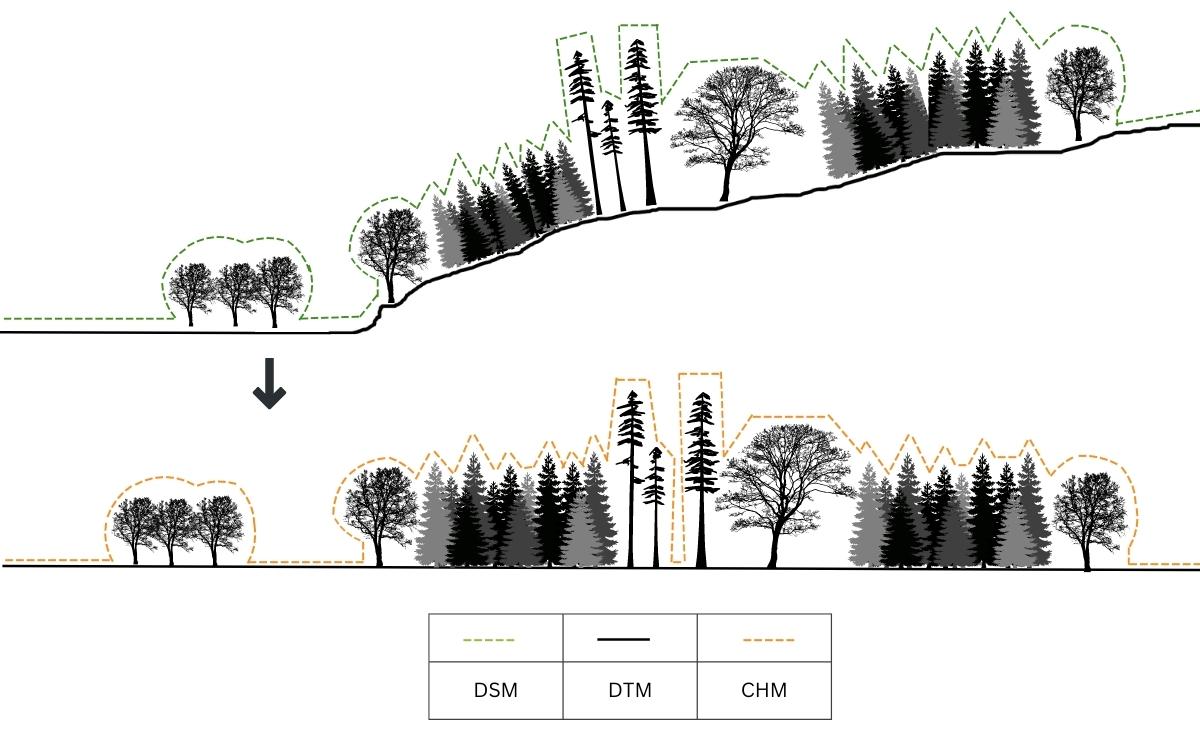 DSM compared to DTM and resulting CHM
Biomass can then be estimated by subtracting the DTM from the DSM within GIS software to give the final canopy height model. This can then undergo further modelling to estimate tree carbon content.
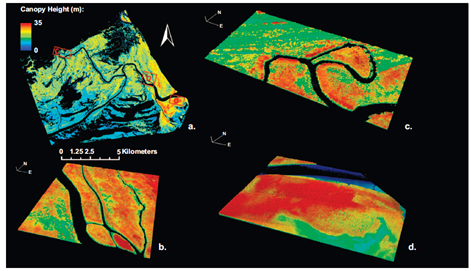
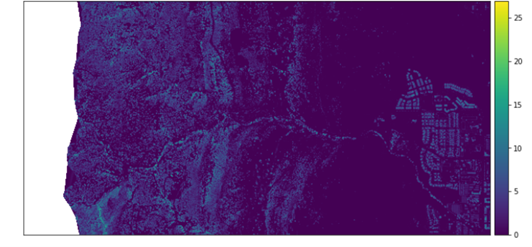 LiDAR derived canopy height model (CHM)
In conclusion, geospatial technologies such as satellites, drones, and LiDAR, combined with GIS software, have revolutionized the way we estimate carbon capture in ecosystems. These technologies allow for information to be captured more quickly, accurately, and over wider areas, providing valuable data to support decision-making. As these technologies continue to evolve and become more affordable, it is expected that they will play an increasingly important role in enabling us to better understand carbon capture.